All published articles of this journal are available on ScienceDirect.

In Silico Evaluation of Anthraquinone Derivatives as Potential α-amylase and α-glucosidase Inhibitors in Diabetes Mellitus
Authors Info & Affiliations
Abstract
Introduction
Diabetes mellitus (DM) is a global health concern associated with impaired glucose metabolism and postprandial hyperglycaemia. Acarbose, an α-amylase and α-glucosidase inhibitor, is widely used but causes gastrointestinal side effects. This study explores anthraquinone-based compounds as potential alternatives with fewer adverse effects. Compounds with different substituents are selected to investigate the effect of structural variations on their interactions with the key carbohydrate digestive enzymes in silico, their physicochemical and cheminformatics profiles.
Methods
Fourteen anthraquinone derivatives were investigated using web tools and in silico methods. ADME properties, drug-likeness, toxicity, and bioactivity were predicted using SwissADME, ADMETlab, ProTox 3.0, and MolPredictX tools. Molecular docking was conducted using AutoDock Vina to test their binding affinities with α-amylase (PDB: 1B2Y) and α-glucosidase (PDB: 5NN8).
Results
All compounds followed Lipinski’s Rule of Five and exhibited binding affinities similar to acarbose. AQ12 and AQ13 demonstrated the strongest interaction with α-amylase, while AQ8 and AQ14 showed potent binding to α-glucosidase. AQ14 formed the highest number of hydrophobic bonds, enhancing binding stability. Most compounds inhibited key catalytic residues, such as His 305 in α-amylase and Asp 518 in α-glucosidase. AQ9 exhibited low predicted toxicity and favourable ADME properties.
Discussion
The results support existing evidence of anthraquinones as promising antidiabetic agents, where few compounds with different structural variations display strong inhibitory potential against α-amylase and α-glucosidase, with binding interactions comparable to acarbose.
Conclusion
This study identifies AQ7, AQ9, and AQ12 to have valuable inhibitory potential against α-amylase and α-glucosidase, supporting their role as antidiabetic drugs. They demonstrated strong binding and favourable pharmacological properties; however further optimization and enhancement is required .
1. INTRODUCTION
DM, a metabolic disorder characterized by elevated blood glucose levels due to impaired glucose metabolism, is a major global health concern. As of 2024, it has affected an estimated 589 million individuals aged 20 to 79 worldwide [1, 2]. DM leads to chronic complications such as retinopathy, inflammatory diseases, neuropathy, nephropathy, and delayed wound healing [1]. Researchers have been actively investigating strategies and developing new drugs to manage blood glucose levels and prevent acute and chronic complications of DM.
Limiting the rate of glucose absorption is a simple strategy for preventing post-prandial hyperglycaemia for several years [3]. These glucose spikes can be minimized by consuming a low-carbohydrate diet and adding an α-glucosidase and amylase inhibitor that inhibits the breakdown of oligosaccharides, polysaccharides, and glycogen into glucose and maltose, respectively [4]. Acarbose is a known inhibitor of both these enzymes. Nevertheless, as it prevents carbohydrate digestion, acarbose has led to gastrointestinal side effects such as bloating, diarrhea, and abdominal discomfort that affect the compliance of using it among diabetic individuals for long-term management [5]. Therefore, scientists have been aiming to discover alternatives to acarbose with fewer adverse effects.
Anthraquinones are a subclass of polyketides within the quinone family, which is characterized by a core structure of three fused benzene rings with ketone groups at the 9,10-carbon [6]. Among their diverse therapeutic applications, anthraquinones have shown promising potential in treating diabetes mellitus, primarily due to their ability to inhibit key carbohydrate-hydrolysing enzymes such as α-amylase and α-glucosidase. Beyond enzyme inhibition, some anthraquinones have been reported to enhance insulin sensitivity and promote glucose uptake, which is essential for maintaining glucose homeostasis [6, 7]. Thus anthraquinone-based compounds are consequently being explored as potential alternatives to conventional diabetic drugs like acarbose.
Based on a diverse range of functional group substitutions 14 anthraquinone derivatives were selected for this study . In a previous study, it was noted that anthraquinones with different structures and substituents, such as emodin, chrysophanol, aloe-emodin, physcion, and rhein, exerted antidiabetic effects through diverse mechanisms [8]. Thus, the selection of 14 derivatives in this study aimed to identify the effect of structural diversity on the bioactivity of anthraquinones. This enables a deeper understanding of how different substituents influence enzyme binding, pharmacokinetics, and therapeutic potential.
2. MATERIALS AND METHODS
2.1. Preparation of Compounds
A total of 14 compounds were selected, tabulated, and coded from AQ1 to AQ14 (Fig. 1). The structure of acarbose is depicted in Fig. (2). SMILES data were obtained from the PubChem database for the physicochemical, ADME (absorption, distribution, metabolism, and excretion), drug-likeness properties, toxicity and biological activity prediction (Table S1). Their structures were also retrieved from the PubChem database in Structural Data File (SDF) format and converted to Protein Data Bank (PDB) format using Open Babel software [9]. The lowest energy conformations were identified using an Amsterdam Modelling Suite (AMS) conformer generator and were used for molecular docking [10].
2.2. Physicochemical, ADME, and Drug-likeness Properties
Using the SMILES of each anthraquinone recorded in Table S1, SwissADME and ADMETlab tools were employed for investigating physicochemical and pharmacokinetic properties, including molecular weight, hydrogen bond donors (HBD) and hydrogen bond acceptors (HBA), topological polar surface area (tPSA), lipophilicity (LogP), solubility (LogS), P-glycoprotein (P-gp) substrates, enzyme inhibitors and bioavailability above 30% (F-30) and Lipinski’s rule of five [11]. Drug-likeness scores were also generated using the MolSoft online tool [12].
2.3. Prediction of Toxicity
The toxicity of each compound was predicted using the Protox 3.0 tool, where organ toxicities such as hepatoxicity, neurotoxicity, nephrotoxicity, respiratory toxicity, and cardiotoxicity were included. The predicted median lethal dose (LD50) and toxicity class (1 to 6, 1 being the most toxic and 6 being the least toxic) were recorded [13].
2.4. Additional Biological Target Prediction
The SwissTargetPrediction tool was used to provide quantitative probabilities for the bioactivity properties of all shortlisted anthraquinones [14].
2.5. Preparation of Protein Structures
The 3D crystal structures of α-amylase (PDB: 1B2Y) and α-glucosidase (PDB: 5NN8) enzymes complexed with the native inhibitor acarbose, which served as a positive control, were downloaded from RCSB, Protein Data Bank in a PDB format, and visualized in Biovia Discovery Studio Visualizer36 V25.1.0.24284 [15]. During preparation, the water molecules and heteroatoms were removed. Further, the protein structures were subjected to energy minimization using Swiss-PDB Viewer (SPDBV) 4.10. The missing atoms in the structures were checked and resolved [16].
2.6. Molecular Docking Studies
Molecular docking was performed on two major hydrolyzing enzymes of carbohydrates using the 14 anthraquinone structures using AutoDock Vina software (Scripps Research Institute, USA). The protein was loaded into the AutoDock tool, polar hydrogen residues and Kollman atomic charges were added, and radii were assigned and saved as PDBQT. All bonds in compounds were kept flexible. All calculations were set for fixed protein and flexible ligand docking using the Lamarckian Genetic Algorithm (LGA) method. Grid boxes were set based on the center of the native ligand of both α-glucosidase and α-amylase, and their XYZ coordinates include X: 107.640 Y: -29.892 Z: 1.991 Å and X: 102.640 Y: 9.850 Z: 29.741 Å, respectively, with a grid size of 40. Command prompt was used to run the Vina, and the best conformation out of ten runs with the lowest docked energy was analyzed for a protein-ligand complex of each phytoconstituent. The average affinity for the best poses was taken as the final affinity value. The interactions of α-glucosidase and α-amylase protein-ligand conformations, including hydrogen and hydrophobic bonds, and their interacting residues were analyzed using BIOVIA Discovery Studio Visualizer [15].
2D structures of the anthraquinone derivatives.
2D structure of acarbose.
3. RESULTS
3.1. Physicochemical, ADME, and Drug-likeness Properties
As shown in Table 1, all compounds satisfied Lipinski’s Rule of Five, indicating good potential for oral bioavailability. The total polar surface area (tPSA) values ranged from 34.14 to 99.72 Å, with hydroxylated compounds (e.g., AQ8, AQ9) and sulfonated compounds (e.g., AQ14) exhibiting the highest values. High tPSA values can enhance solubility but may limit membrane permeability. Hydroxyl-rich derivatives such as quinizarin (AQ8) and alizarin (AQ9) also demonstrated the highest hydrogen bond acceptor (HBA) and donor (HBD) counts, contributing to solubility yet potentially hindering passive diffusion. AQ14, being sulfonated, showed both high tPSA and molecular weight, which may reduce passive absorption while potentially offering targeted solubility and transport benefits. Conversely, chlorinated compounds like AQ3 and AQ6 had low HBD counts and higher LogP values, indicating better membrane permeability.
LogP values, indicating lipophilicity, ranged from 1.64 to 3.77 across most compounds, which is within the ideal range for passive membrane diffusion. AQ12, however, exceeded this range significantly (LogP = 5.62). Distribution coefficients (LogD) for all compounds were within the acceptable range (1–5), reflecting balanced hydrophilic/lipophilic profiles suitable for systemic distribution (Table 2).
Solubility analysis (LogS) revealed that most compounds had poor aqueous solubility (LogS < –5), except AQ13 and AQ14, which showed better solubility with values of –3.47 and –3.69, respectively. Poor solubility remains a limiting factor for many anthraquinone derivatives and may require formulation strategies for enhancement (Table 2).
Caco-2 cell permeability, an indicator of intestinal absorption, was below the optimal threshold (>4.70) for all compounds, suggesting limited passive intestinal uptake. However, most compounds were predicted to be non-inhibitors and non-substrates of P-gp, which is favourable for reducing efflux-related resistance and improving intracellular drug concentrations. Bioavailability, measured as F-20 and F-30 (bioavailability above 20% and 30%, respectively), was predicted to be high for most compounds. AQ2, AQ8, AQ9, and AQ12 stood out with favourable absorption potential (Table 2).
In terms of distribution, plasma protein binding (PPB) was very high across all compounds (94–99%), implying reduced levels of free, pharmacologically active drugs in systemic circulation but potentially longer half-life due to reservoir effects. Blood-brain barrier (BBB) penetration was achieved only by a few compounds, notably AQ3, AQ4, AQ5, AQ6, AQ10, and AQ11, suggesting selective central nervous system (CNS) exposure. The volume of distribution (VD) was above the threshold (>0.07 L/kg) for nearly all compounds, with particularly high VD values observed for AQ12 (2.646) and AQ14 (1.01), suggesting extensive tissue distribution (Table 2).
| Compound | Chemical Name | tPSA (Å) | LogP | HBA | HBD | Molecular Weight (MW/mol) | Lipinski's Rule of 5 |
|---|---|---|---|---|---|---|---|
| AQ1 | 1-(methylamino)anthraquinone | 46.17 | 2.31 | 2 | 1 | 237.25 | Yes |
| AQ2 | 1,4-diaminoanthraquinone | 86.18 | 1.64 | 2 | 2 | 238.24 | Yes |
| AQ3 | 1,5-dichloroanthraquinone | 34.14 | 3.77 | 2 | 0 | 277.1 | Yes |
| AQ4 | 1-chloroanthraquinone | 34.14 | 3.12 | 2 | 0 | 242.66 | Yes |
| AQ5 | 2-chloroanthraquinone | 34.14 | 3.12 | 2 | 0 | 242.66 | Yes |
| AQ6 | 1,8-dichloroanthraquinone | 34.14 | 3.77 | 2 | 0 | 277.1 | Yes |
| AQ7 | 2-hydroxyanthraquinone | 54.37 | 2.17 | 3 | 1 | 224.21 | Yes |
| AQ8 | 1,4-dihydroxyanthraquinone (quinizarin) | 74.6 | 1.87 | 4 | 2 | 240.21 | Yes |
| AQ9 | 1,2-dihydroxyanthraquinone (alizarin) | 74.6 | 1.87 | 4 | 2 | 240.21 | Yes |
| AQ10 | Anthraquinone | 34.14 | 2.46 | 2 | 0 | 208.21 | Yes |
| AQ11 | 2-methylanthraquinone | 34.14 | 2.77 | 2 | 0 | 222.24 | Yes |
| AQ12 | 2-tert-butylanthraquinone | 34.14 | 3.76 | 2 | 0 | 264.32 | Yes |
| AQ13 | Anthraquinone-2-carboxylic acid | 71.44 | 2.16 | 4 | 1 | 252.22 | Yes |
| AQ14 | Sodium anthraquinone-2-sulfonate | 99.72 | 2.45 | 5 | 0 | 328.27 | Yes |
| Compound | Physicochemical Property | Absorption (>0.5) | Distribution | ||||||||
|---|---|---|---|---|---|---|---|---|---|---|---|
| LogS (>-4) | LogD (1-5) | LogP (0-3) | Caco-2 (>4.70) | P-gp Inhibitor | P-gp Substrate | F-20 | F-30 | PPB | BBB (≥0.1) | VD (>0.07 L/kg) | |
| AQ1 | -6.158 | 3.552 | 3.972 | -4.655 | +++ | --- | --- | - | 95.50% | -- | 0.341 |
| AQ2 | -6.226 | 2.963 | 3.284 | -5.019 | +++ | --- | --- | + | 81% | --- | 0.791 |
| AQ3 | -5.68 | 3.436 | 3,686 | -4.491 | +++ | --- | --- | -- | 98.50% | ++ | 0.11 |
| AQ4 | -5.41 | 3.311 | 3.48 | -4.393 | +++ | --- | --- | -- | 98.10% | - | 0.116 |
| AQ5 | -5.855 | 3.398 | 3.913 | -4.245 | +++ | --- | --- | --- | 98.50% | + | 0.002 |
| AQ6 | -5.764 | 3.451 | 3.724 | -4.64 | +++ | --- | --- | --- | 98.80% | ++ | 0.126 |
| AQ7 | -5.884 | 3.134 | 3.329 | -4.661 | ++ | --- | --- | -- | 94.80% | --- | 0.249 |
| AQ8 | -5.832 | 3.338 | 3.743 | -4.674 | ++ | --- | --- | ++ | 95.80% | --- | 0.62 |
| AQ9 | -5.058 | 2.688 | 2.768 | -4.77 | +++ | --- | --- | ++ | 97.20% | --- | -0.371 |
| AQ10 | -5.247 | 3.036 | 3.171 | -4.223 | +++ | --- | --- | - | 95.40% | -- | 0.211 |
| AQ11 | -5.872 | 3.525 | 3.897 | -4.294 | +++ | --- | --- | -- | 97.70% | -- | 0.261 |
| AQ12 | -6.516 | 4.38 | 5.622 | -4.626 | +++ | --- | --- | + | 98.40% | --- | 2.646 |
| AQ13 | -3.472 | 1.919 | 2.823 | -4.61 | +++ | --- | --- | -- | 98.90% | --- | -0.909 |
| AQ14 | -3.687 | 1.941 | 2.008 | -4.44 | +++ | --- | --- | --- | 97.30% | --- | 1.01 |
Drug-likeness scores were calculated using the Molsoft online tool, with an ideal range of 0 to 2, as depicted in Fig. (3). None of the anthraquinone derivatives met this threshold, likely due to high molecular weights, excessive lipophilicity, rigid aromatic frameworks, or suboptimal hydrogen bonding characteristics. However, compounds with scores closer to the lower end (more negative) were considered better candidates for lead optimization. AQ13 showed the most favourable score (–0.06), followed by AQ7 (–0.14), AQ5 (–0.30), and AQ9 (–0.35). Notably, AQ13 and AQ9 also demonstrated strong binding profiles, making them top candidates for further refinement.
Drug-likeness scores of anthraquinones. Cut-off value ranges from 0 to 2.
| Compound | Metabolism (>0.5) | Excretion | Toxicity (< 0.5) | ||||||||||||
|---|---|---|---|---|---|---|---|---|---|---|---|---|---|---|---|
| 1A2 | 3A4 | 2C9 | 2C19 | 2D6 | t1/2 | CL(ml/min/kg) | hERG | LD50 (mg/kg) | FDAMDD | ||||||
| I | S | I | S | I | S | I | S | I | S | ||||||
| AQ1 | +++ | +++ | -- | --- | --- | --- | ++ | ++ | --- | --- | 0.936 | 6.33 | 0.192 | 5000 | 0.256 |
| AQ2 | --- | +++ | +++ | --- | ++ | --- | --- | +++ | -- | --- | 2.536 | 4.226 | 0.088 | 5790 | 0.257 |
| AQ3 | +++ | +++ | --- | --- | --- | --- | ++ | --- | --- | --- | 1.045 | 4.177 | 0.185 | 1000 | 0.291 |
| AQ4 | +++ | +++ | --- | --- | --- | --- | --- | -- | -- | --- | 1.188 | 5.159 | 0.174 | 1000 | 0.273 |
| AQ5 | +++ | +++ | --- | -- | -- | --- | -- | - | ++ | --- | 1.109 | 5.573 | 0.264 | 1000 | 0.301 |
| AQ6 | +++ | +++ | --- | --- | --- | --- | --- | ++ | --- | --- | 0.982 | 5.06 | 0.187 | 1000 | 0.287 |
| AQ7 | +++ | +++ | + | --- | -- | --- | -- | -- | ++ | --- | 1.023 | 10.875 | 0.15 | 7000 | 0.371 |
| AQ8 | +++ | +++ | --- | --- | --- | --- | --- | -- | --- | --- | 1.514 | 12.07 | 0.042 | 5000 | 0.277 |
| AQ9 | +++ | +++ | --- | --- | --- | --- | --- | --- | --- | --- | 1.66 | 12.248 | 0.08 | 7000 | 0.316 |
| AQ10 | +++ | +++ | -- | --- | --- | --- | --- | ++ | ++ | --- | 1.97 | 6.847 | 0.165 | 5000 | 0.26 |
| AQ11 | +++ | +++ | ++ | --- | + | --- | -- | + | +++ | --- | 1.596 | 7.31 | 0.175 | 2795 | 0.282 |
| AQ12 | +++ | - | --- | -- | ++ | --- | +++ | --- | ++ | --- | 0.49 | 7.087 | 0.272 | 2795 | 0.548 |
| AQ13 | +++ | + | --- | --- | -- | +++ | - | --- | +++ | --- | 1.791 | 1.162 | 0.095 | 900 | 0.238 |
| AQ14 | +++ | +++ | --- | --- | --- | --- | --- | -- | -- | --- | 1.357 | 3.76 | 0.145 | 2357 | 0.555 |
3.2. Prediction of Toxicity
The toxicological assessment indicated low to moderate hERG inhibition (cardiotoxicity risk) for most compounds, with AQ5 and AQ12 showing slightly higher values (Table 3). Median lethal dose (LD50) values ranged from 900 to 7000 mg/kg, with AQ13 being the most toxic and AQ7/AQ9 being the least in comparison. FDA maximum recommended daily dose (FDAMDD) predictions were acceptable for most compounds, with AQ12 and AQ14 showing higher tolerable limits.
3.3. Biological Target Prediction
Biological target prediction using SwissTargetPrediction revealed that enzymes, particularly oxidoreductases, were the most frequent predicted targets. AQ9 and AQ13 showed the broadest range of predicted interactions, while AQ4 and AQ6 demonstrated narrower target specificity. The bioactivity scores are recorded in Fig. (4).
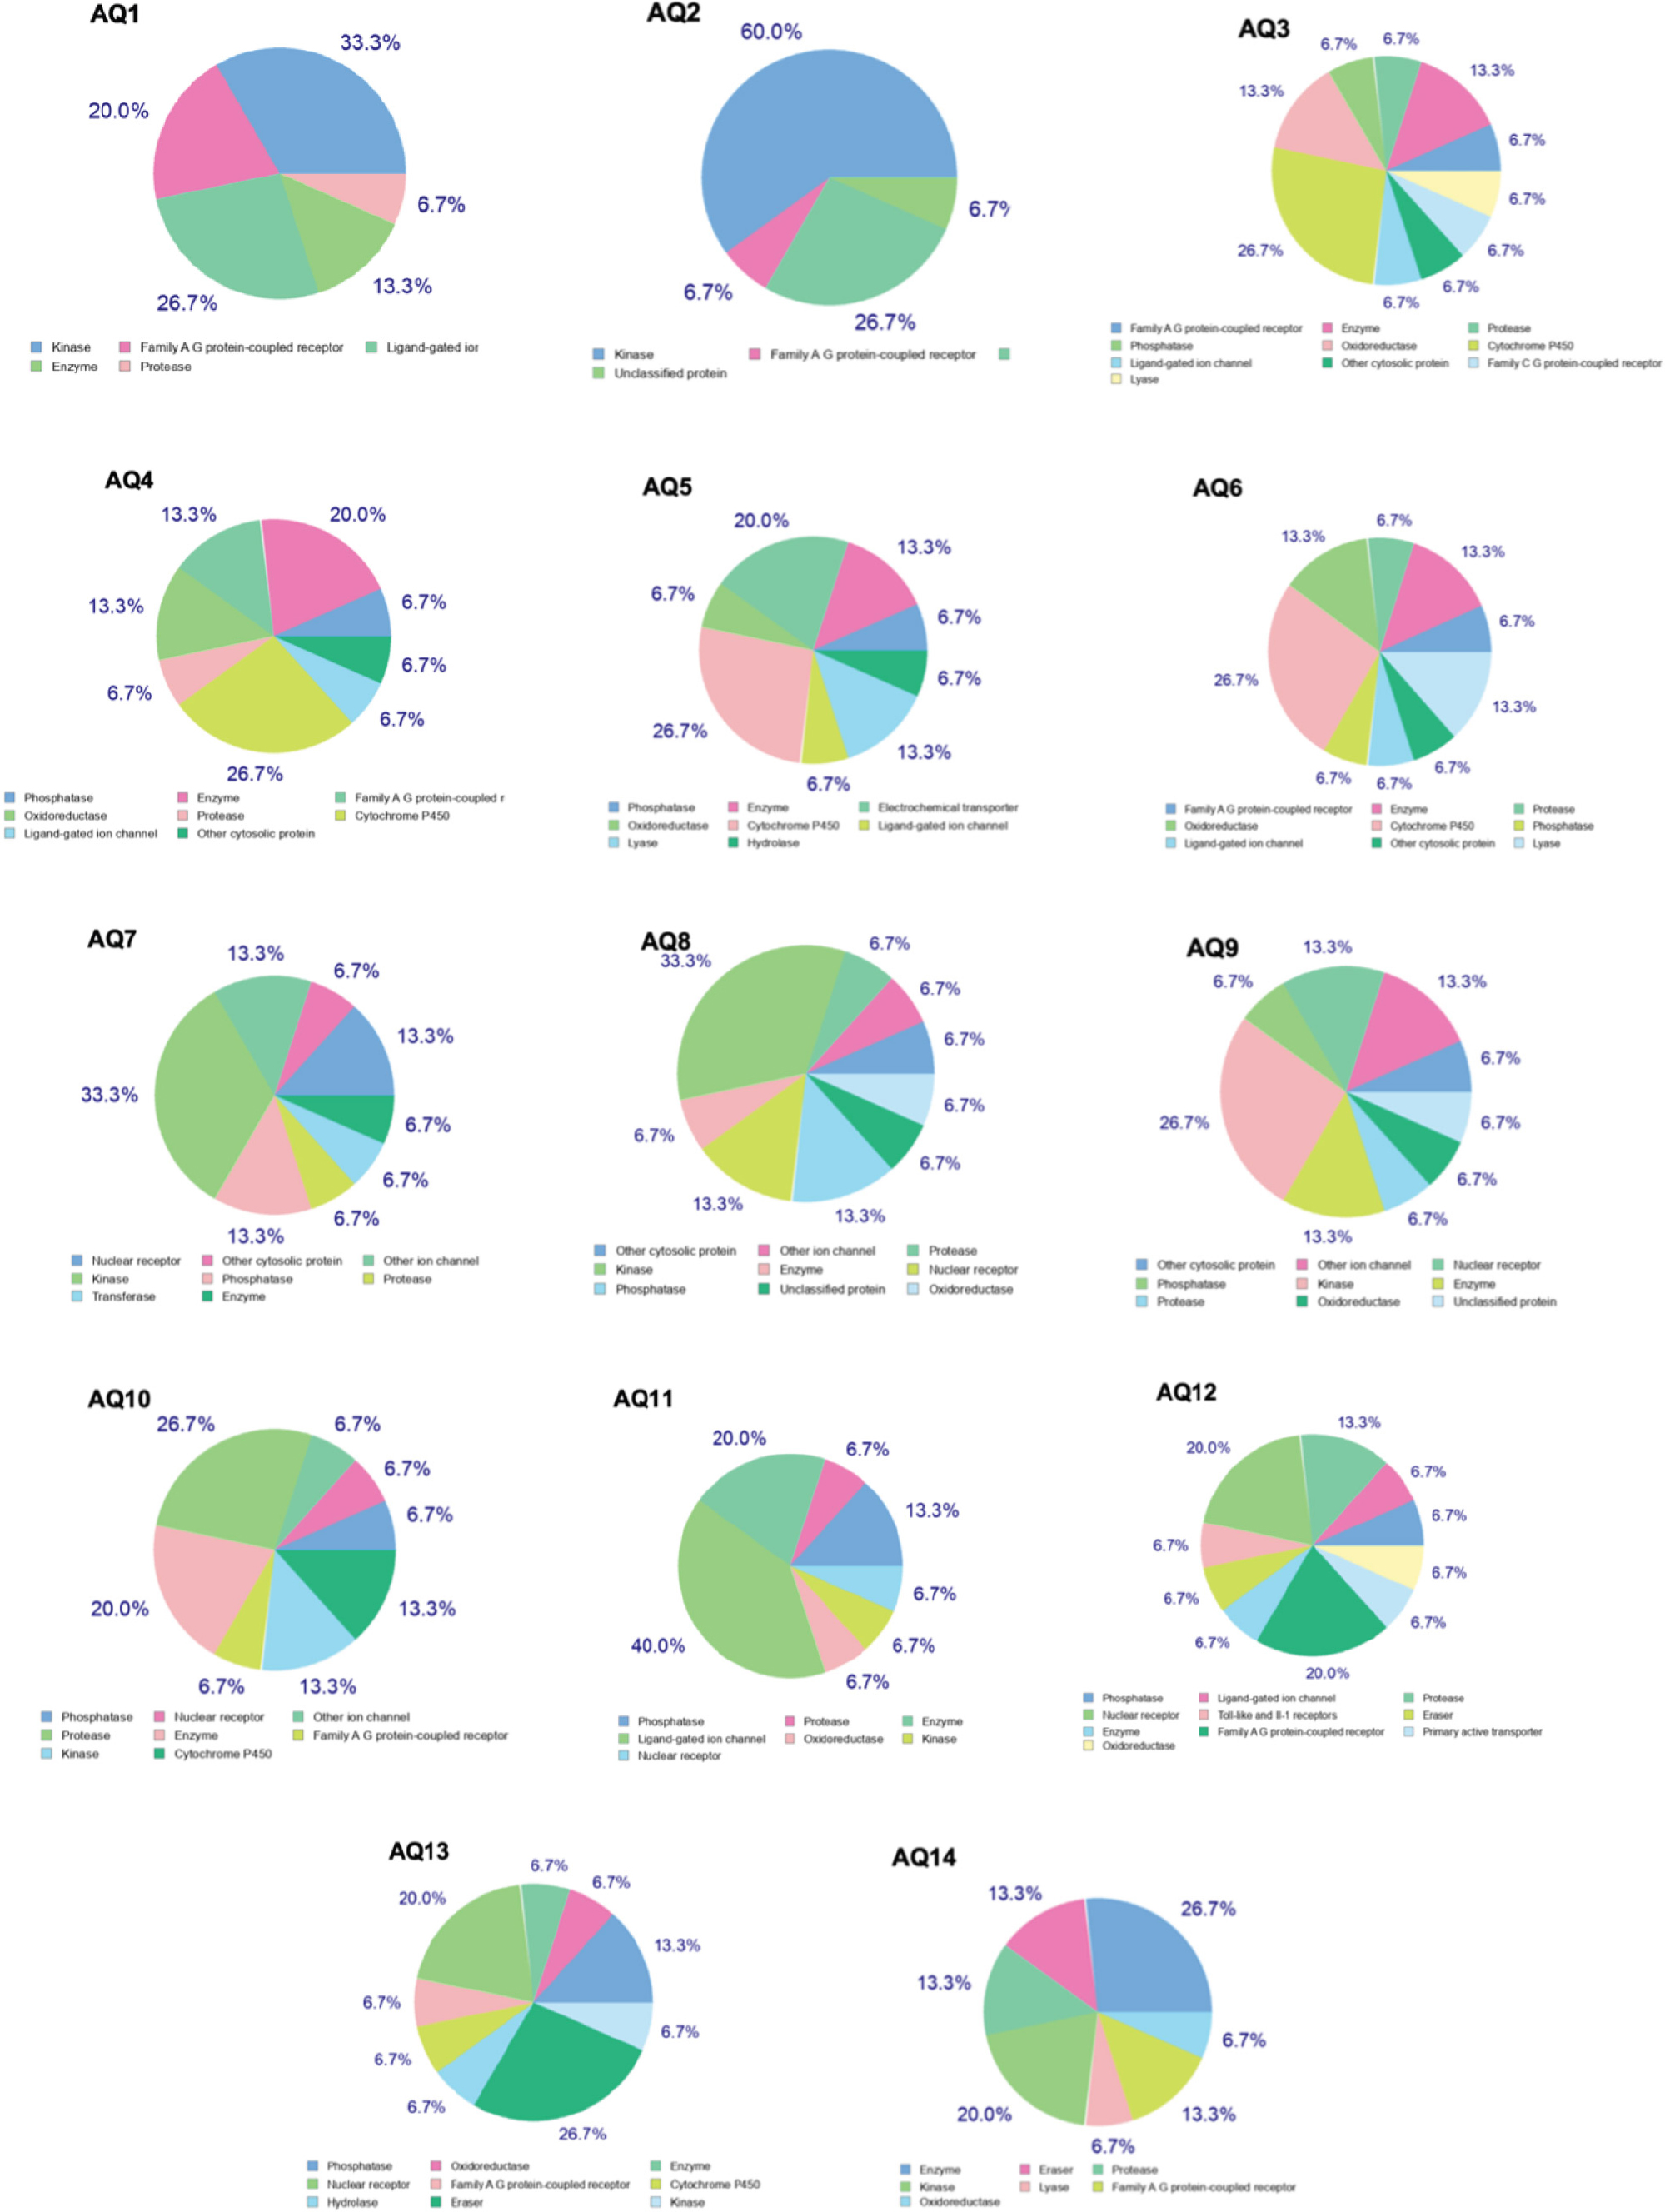
Predicted targets of the 14 compounds using the swisstargetprediction tool.
3.4. In Silico Docking Study with α-amylase and α-glucosidase
Molecular docking studies provided insights into the binding interactions and affinities of the compounds with α-amylase (Table 4). Acarbose, used as a reference ligand, demonstrated the strongest binding with a binding energy of –9.2 kcal/mol and the highest number of total contacts (24), including 13 hydrogen bonds. Among the test compounds, AQ12 and AQ13 exhibited the best binding affinities (both –9.0 kcal/mol), each forming two hydrogen bonds alongside van der Waals (VDW) and hydrophobic interactions. AQ2, AQ9, and AQ14 also showed promising binding energies (–8.5 kcal/mol), forming multiple hydrogen bonds (3–5). Key residues involved in binding across multiple compounds included His 305, Gln 63, and Trp 58/59, indicating their importance in the active or binding site. The involved residues and binding pose of the top four protein-ligand complexes with the highest number of interactions with α-amylase are displayed in Fig. (5A-D), while the others are displayed in Fig. (S1).
In the subsequent docking comparison as displayed in Table 5, acarbose showed the strongest affinity (–8.35 kcal/mol), forming eight hydrogen bonds with α-glucosidase followed by AQ8 (–7.7 kcal/mol), AQ13, and AQ14 (–7.4 kcal/mol), with AQ14 displaying the highest number of total contacts (17) and extensive hydrophobic interactions with α-glucosidase. Frequent binding site residues included Arg 600, Asp 282, Met 519, Trp 481, and Phe 649. Some compounds, such as AQ12, AQ3, AQ5, and AQ6, showed moderate binding affinities (–7.2 to –6.0 kcal/mol), with interaction profiles dominated by VDW and hydrophobic interactions rather than hydrogen bonding. AQ4 demonstrated the lowest binding affinity (–5.9 kcal/mol) with minimal interactions. The involved residues and binding pose of the top four protein-ligand complexes with the highest number of interactions with α-glucosidase are displayed in Fig. (6A-D), while the others are displayed in Fig. (S2).
| Compounds | Total Contacts | Energy (Kcal/mol) | H Bonds | Van der Waals | Hydrophobic Interactions |
|---|---|---|---|---|---|
| AQ12 | 13 | -9.0 | 2 (His 305, Gln 63) | 8 (Trp 58, Asp 300, Ala 198, His 299, Leu 162, Asp 197, Leu 165, Thr 163) | 3 (Trp 59 -2, Tyr 62) |
| AQ13 | 10 | -9.0 | 2 (His 305, Gln 63) | 5 (His 101, Trp 58, Tyr 62, Asp 197, Thr 163) | 3 (Trp 59 -2, Leu 165) |
| AQ8 | 10 | -8.8 | 2 (His 305, Gln 63) | 5 (Trp 58, Leu 165, His 101, Tyr 62, Asp 197) | 2 (Trp 59) |
| AQ2 | 11 | -8.5 | 5 (Tyr 62 -2, Gln 63, His 305, Asp 300) | 4 (Thr 163, Leu 165, His 101, Trp 58) | 2 (Trp 59) |
| AQ9 | 12 | -8.5 | 3 (His 305, Asp 300, Gln 63) | 5 (His 299, Trp 58, His 101, Leu 165, Thr 163) | 3 (Trp 59 -2, Tyr 62) |
| AQ14 | 13 | -8.5 | 4 (His 305 -2, Trp 59, Gln 63) | 4 (Trp 58, Tyr 62, Asp 356, Trp 357) | 5 (His 305, Trp 59 -3, Leu 165) |
| AQ11 | 11 | -8.4 | 2 (His 305, Gln 63) | 5 (Trp 58, Asp 197, His 101, Leu 165, Thr 163) | 4 (Trp 59 -2, Tyr 62 -2) |
| AQ3 | 8 | -8.3 | 2 (His 305, Gln 63) | 1 (Tyr 62) | 5 (Trp 59 -3, Trp 58, Leu 165) |
| AQ4 | 9 | -8.2 | 2 (His 305, Gln 63) | 2 (Trp 58, Tyr 62) | 4 (Trp 59 -3, Leu 165) |
| AQ5 | 11 | -8.2 | 2 (His 305, Gln 63) | 5 (Trp 58, Asp 197, His 101, Leu 165, Thr 163) | 4 (Trp 59 -2, Tyr 62 -2) |
| AQ6 | 10 | -8.0 | 2 (His 305, Gln 63) | 5 (Tyr 62, Leu 165, Thr 163, Gly 104, Trp 58) | 3 (Trp 59) |
| AQ7 | 9 | -7.9 | 2 (His 305, Gln 63) | 4 (Tyr 62, Leu 165, Thr 163, Trp 58) | 3 (Trp 59) |
| AQ10 | 9 | -7.9 | 2 (His 305, Gln 63) | 5 (Trp 58, Tyr 62, His 101, Leu 165, Thr 163) | 2 (Trp 59) |
| AQ1 | 9 | -7.8 | 2 (His 305, Asp 300) | 6 (Trp 58, Gly 306, Asp 197, Tyr 62, Leu 165, Gln 63) | 1 (Trp 59) |
| Acarbose | 24 | -9.2 | 13 (Thr 163, Gln 63 -2, Trp 59, His 299, Asp 300 -2, Glu 233, Arg 195, Gly 306, Lys 200, His 305, Tyr 62) | 9 (Gly 104, Leu 165, Trp 58, His 101, Leu 162, Tyr 151, His 201, Ile 235, Asp 197) | 2 (Ala 198, Tyr 62) |
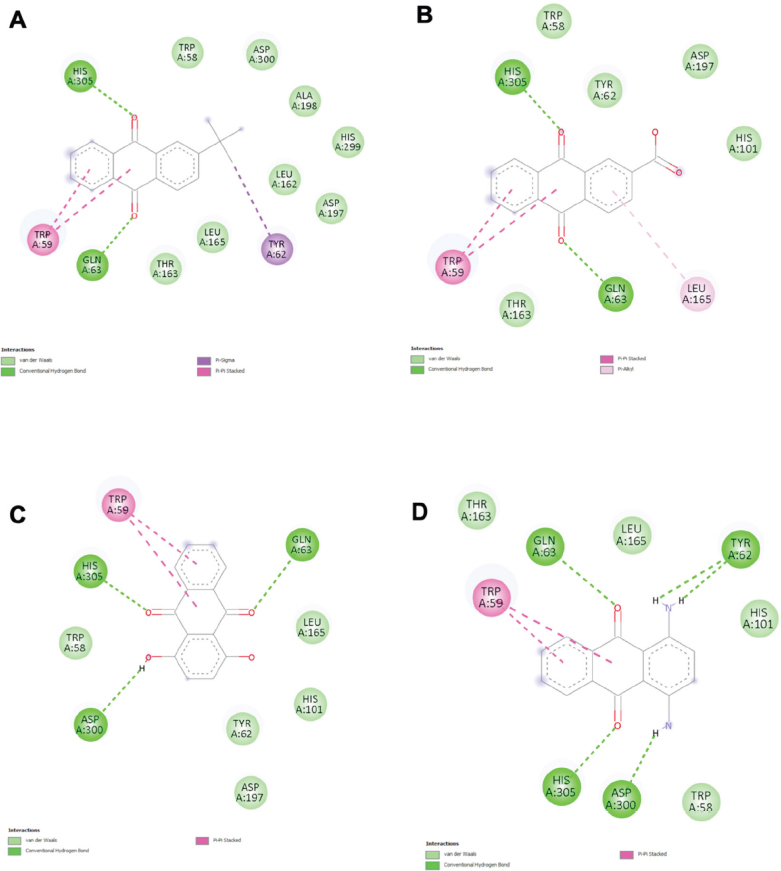
The 2D diagram of receptor-ligand interaction shows the docking conformation of the top four compounds with the highest number of interactions, (A) AQ12, (B) AQ13, (C) AQ8, (D) AQ2, in the binding site of α-amylase. Interactions in light and dark green colours represent hydrogen bonds; interactions in light pink, dark pink, or purple colours represent hydrophobic interactions.
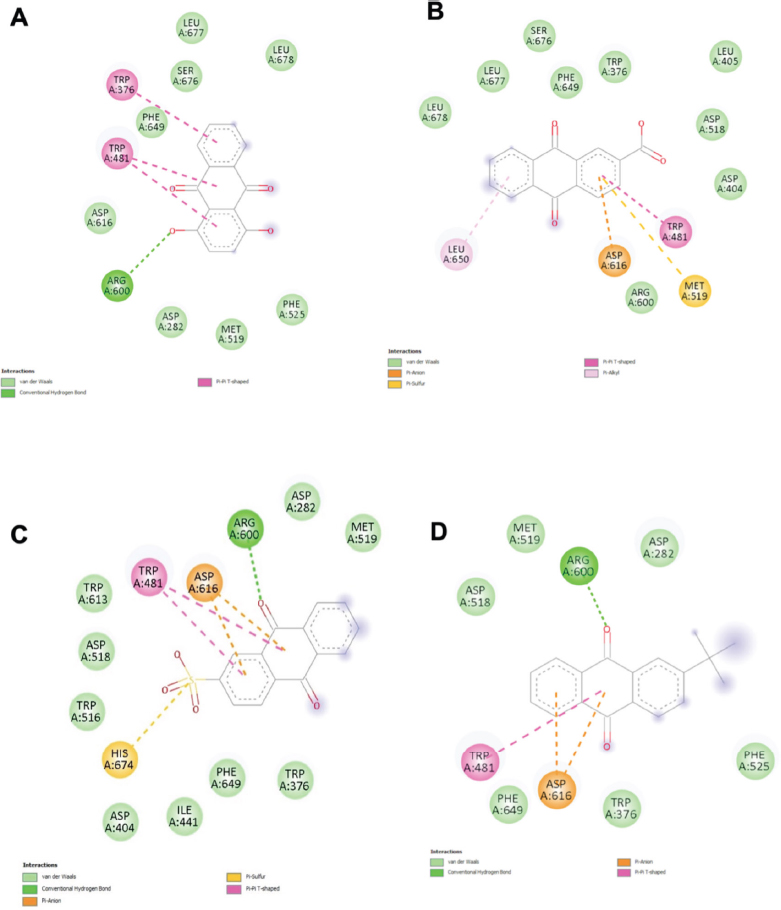
The 2D diagram of receptor-ligand interaction shows the docking conformation of the top four compounds with the highest number of interactions, (A) AQ8, (B) AQ13, (C) AQ14, and (D) AQ12 in the binding site of α-glucosidase. Interactions in light and dark green colours represent hydrogen bonds; interactions in pink or purple colours represent hydrophobic interactions.
| Compounds | Total Contacts | Energy (Kcal/mol) | H Bonds | Van der Waals | Hydrophobic Interactions |
|---|---|---|---|---|---|
| AQ8 | 12 | -7.7 | 1 (Arg 600) | 8 (Leu 677, Leu 678, Ser 676, Phe 649, Asp 616, Asp 282, Met 519, Phe 525) | 3 (Trp 376, Trp 481 -2) |
| AQ13 | 13 | -7.4 | - | 9 (Leu 678, Leu 677, Ser 676, Phe 649, Trp 376, Leu 405, Asp 518, Asp 404, Arg 600) | 4 (Trp 481, Met 519, Asp 616, Leu 650) |
| AQ14 | 17 | -7.4 | 1 (Arg 600) | 8 (Trp 376, Phe 649, Ile 441, Asp 404, Trp 516, Trp 613, Asp 282, Met 519) | 8 (Asp 616 -2, Trp 481 -2, Asp 518 -2, His 674 -2) |
| AQ12 | 8 | -7.2 | - | 6 (Trp 481, Trp 376, Phe 649, Leu 650, Asp 616, Asp 282) | 2 (Phe 525) |
| AQ11 | 14 | -6.8 | 1 (Arg 600) | 7 (Phe 525, Asp 282, Met 519, Asp 518, Trp 613, Phe 649, Trp 376) | 6 (Asp 616 -2, Trp 481 -2, His 674, Trp 516) |
| AQ2 | 14 | -6.7 | 2 (Arg 600, Asp 282) | 7 (Phe 525, Met 519, Trp 516, Asp 518, Phe 649, Asp 404, Trp 376) | 5 (Asp 616 -2, Trp 481 -3) |
| AQ9 | 12 | -6.7 | 2 (Arg 600, Asp 518) | 6 (Asp 282, Phe 525, Met 519, Trp 613, Phe 649, Trp 376) | 4 (Arg 600, Asp 616, Trp 481) |
| AQ1 | 10 | -6.6 | 2 (Asp 282, Ser 676) | 4 (Leu 678, Leu 677, Phe 649, Trp 376) | 4 (Leu 650 -2, Asp 616, Trp 481) |
| AQ10 | 12 | -6.4 | - | 9 (Leu 678, Leu 677, Ser 676, Phe 649, Asp 616, Arg 600, Asp 282, Met 519, Phe 525) | 3 (Trp 376, Trp 481 -2) |
| AQ7 | 9 | -6.4 | 1 (Arg 600) | 5 (Asp 518, Met 519, Asp 282, Trp 376, Phe 649) | 3 (Trp 481, Asp 616 -2) |
| AQ3 | 11 | -6.3 | - | 7 (Arg 600, Asp 282, Leu 678, Ser 676, Phe 649, Trp 376, Leu 677) | 4 (Trp 481, Met 519, Asp 616, Leu 650) |
| AQ5 | 13 | -6.2 | - | 7 (Leu 677, Ser 676, Phe 649, Ile 441, Asp 404, Asp 518, Arg 600) | 6 (Asp 616 -2, Met 519, Trp 481, Trp 376, Leu 650) |
| AQ6 | 12 | -6.0 | - | 9 (Arg 281, Leu 283, Ala 284, Leu 650, Phe 649, Trp 481, Met 519, Phe 525, Ser 523) | 3 (Asp 282 -2, Asp 616) |
| AQ4 | 9 | -5.9 | 1 (Gln 623) | 4 (Pro 285, Thr 286, Pro 287, Glu 622) | 4 (Trp 618 -3, Ser 620) |
| Acarbose | 10 | -8.35 | 8 (Asp 518, Asp 443, Ala 284, Trp 618, Asp 616, His 674, Asp 404, Trp 376) | 1 (Phe 649) | - |
4. DISCUSSION
We evaluated the ADME profiles, toxicity parameters, and predicted biological activities to assess the drug-likeness and therapeutic potential of a series of anthraquinone derivatives. Their inhibitory effects on α-amylase and α-glucosidase enzymes, which play crucial roles in postprandial glucose regulation, were predicted using an in silico approach. Anthraquinones with a range of substitutions such as methylamino, diamino, chloro (mono- and di-substituted at different positions), hydroxy (mono- and di-substituted), methyl, tert-butyl, carboxylic acid, and sulfonate groups were investigated in this study. These groups were chosen for their varying steric, hydrophilic, or lipophilic properties, which can significantly influence enzyme binding affinity, membrane permeability, and solubility. Hydrophilic hydroxy and carboxylic acid groups enhance hydrogen bonding and water solubility, which may improve enzyme binding and bioavailability [17, 18]. Methylamino and diamino groups, both electron-donating and hydrophilic, can contribute to polarity and may enhance interaction with charged or polar residues in the enzyme’s active site [19]. Mono- and di-substituted chlorine substitutions are known to increase lipophilicity and membrane permeability, potentially enhancing oral absorption [20]. The tert-butyl group, being bulky and hydrophobic, was included to examine the impact of its steric hindrance and hydrophobic interactions through its methyl groups [21]. Lastly, the sulfonate group was included to test the effects of high polarity on interactions at the binding site [22]. These structural modifications were selected to explore the impact of functional group variation on enzyme inhibition and pharmacokinetic behaviour, thereby aiding in the identification of safer and more efficacious anthraquinone-based drug candidates.
All tested anthraquinone derivatives met Lipinski’s RO5, suggesting good potential for oral bioavailability. It is generally deemed that compounds obeying this rule are drug-like. The tPSA of the anthraquinones was below 140 Å indicating smooth penetration of the membranes and thus good intestinal absorption [23]. Hydroxylated anthraquinones, such as AQ8 (quinizarin) and AQ9 (alizarin), along with the sulfonated compound AQ14, exhibited the highest tPSA values. High tPSA is associated with enhanced aqueous solubility but may impede membrane permeability, potentially affecting passive diffusion across biological membranes. However, such features might offer advantages in terms of targeted solubility and transporter-mediated uptake, warranting further investigation into their pharmacokinetic behaviour [24].
The LogP values for the tested compounds were on average between 1 to 3, which suggested that the compounds acquire a balance of lipophilicity and solubility, making them a desirable drug candidates [25]. Chlorinated compounds, such as AQ3 and AQ6, exhibited lower HBD counts and higher LogP values, suggesting improved membrane permeability. This is due to increased lipophilicity. These properties may facilitate superior passive diffusion, making them attractive candidates for oral delivery [26]. However, the potential toxicity associated with halogenated compounds necessitates careful assessment [26].
The Caco-2 permeability values also suggest that all anthraquinones have a moderately high permeability, except AQ2, which has a lower permeability. While AQ13 and AQ14 demonstrate better solubility than others, with LogS values recorded above -3, further adjustments will be required to enhance their solubility. The hydrogen binding abilities vary among the compounds, but sulfonated anthraquinone AQ14 was noted to have the highest number of HBA, indicating that it could interact strongly in polar surroundings [27]. This result is further supported by AQ14 having the highest tPSA. Both outcomes propose that AQ14 may encounter challenges in crossing lipid membranes while having higher solubility, which may affect its absorption. These findings are consistent with a previous study using the Caco-2 cell line, which showed that compounds with high tPSA and strong hydrogen binding ability reduced Caco-2 permeability due to limited passive diffusion across the intestinal epithelium [28].
P-gps are membrane transporters that actively pump drugs out of cells, serving as a drug efflux pump [29]. It is noteworthy that most compounds were predicted to be non-inhibitors and non-substrates of P-gp, which is favourable for reducing efflux-related resistance and improving intracellular drug concentrations. While their LogD values are well within the cut-off limit, they are mostly bound to plasma proteins, indicating few free active molecules to display therapeutic effects [30]. The high PPB observed for all compounds (94–99%) suggests that the drugs will primarily circulate in a bound form, which could prolong their half-life and sustain therapeutic levels over time. A study reported that emodin, an anthraquinone compound, exhibited high PPB, which contributed to delayed onset and prolonged drug action, but also required careful consideration of its free drug concentrations and potential therapeutic windows [31]. AQ3, AQ4, AQ5, AQ6, AQ10, and AQ11 demonstrated the ability to cross the BBB, suggesting potential CNS activity. Previous work has indicated that anthraquinones such as rhein and emodin can cross the BBB, which opens possibilities for treating neurological conditions [32].
CYP1A2 and CYP3A4 are enzymes found in the liver that primarily metabolise a range of drugs and endogenous molecules [33]. CYP1A2 is inhibited by 13 of the anthraquinone compounds, with AQ2 being the exception, indicating that their ability to interfere with the metabolism of other drugs that are degraded by this enzyme. CYP3A4 is not involved in the metabolism of all 14 compounds in this investigation, which reduces the risk of drug interactions. In contrast to its lack of inhibition towards CYP1A2, AQ2 was recorded to be the strongest inhibitor of CYP3A4, suggesting that it may require strict dose adjustments and modifications to avoid interfering with the metabolism of other drugs by this enzyme [34].
The elimination half-life (t1/2) of a drug shows the time taken to remove 50% of the drug, while clearance refers to the rate of drug removal from the plasma. Out of the 14 compounds, 10 had clearance between 5 to 15 mL/min/kg, indicating a moderate rate of elimination on average [35]. The other four anthraquinones, noted as AQ2, AQ3, AQ13, and AQ14, had a slower clearance, suggesting that these compounds would stay in the body for a longer period. In addition, AQ2 had the longest half-life among all compounds, which suggests that AQ2 remains in the circulation longer and may be beneficial for sustained therapeutic actions.
In terms of toxicity, AQ7 and AQ9 are classified as Class IV (non-toxic) and are considered the safest compounds among the rest, with a high LD50. Meanwhile, AQ13, placed in Class VI (harmful if swallowed), may cause mild harm if ingested.
Viewing their bioactivity, most anthraquinones are predicted to interact with enzymes, especially oxidoreductases, which is consistent with the redox-active nature of anthraquinone scaffolds. AQ9 and AQ13, showing the widest range of predicted interactions, suggest multi-target therapeutic potential. In contrast, AQ4 and AQ6, with narrower target specificity, potentially offer advantages in applications requiring focused action with fewer off-target effects.
Drug-likeness scores quantitatively shows the potential of a compound to become an orally bioavailable drug. ADME results and drug-likeness scores suggested that AQ3 has a high potential as an oral drug. It obtained the highest LogP and exhibited a drug-likeness score closest to 0. A high LogP points out that AQ3 has better lipid solubility and thus penetrates the membrane more easily. AQ3 would require several optimisations to achieve a higher drug-likeness, but it has demonstrated promising potential. Nevertheless, multiple oral drugs were proven to be therapeutically effective despite failing Lipinski’s RO5 with a low drug-likeness [36]. Among the 14 compounds investigated in this experiment, although 13 of them exhibited relatively low drug-likeness, they could still hold potential as an oral drug with further optimisation [37].
Analysis of anthraquinones' interaction with α-amylase revealed that all 14 compounds form hydrogen and hydrophobic bonds with the key amino acid residues surrounding the binding site. AQ12 and AQ13 exhibited the strongest binding affinities with a low binding energy (-9.0 kcal/mol). The top three compounds with the highest binding affinity with α-amylase were listed as AQ12, AQ13, and AQ8. These compounds formed van der Waals bonds with 9 similar key residues in the native crystal structure. Overlapping residues across the three compounds include Trp 58 and Asp 197. Asp 197 is a key catalytic residue in α-amylase, indicating that all 3 compounds exhibit similar binding interactions as acarbose. AQ12, being the compound with the greatest binding affinity to α-amylase, was noted to have a tert-butyl group, which is a hydrophobic group. A study reported that known α-amylase inhibitors form hydrophobic interactions within the enzyme’s active site, which is lined with hydrophobic residues such as Trp 59 [38]. This aligns with the enzyme’s function of breaking down large, non-polar polysaccharides. A hydrophobic active site would be necessary to accommodate these non-polar polysaccharides. Therefore, the hydrophobic tert-butyl group of AQ12 fits well into the active site of α-amylase, forming a strong bond between the two.
AQ8 and AQ13 possess hydroxyl and carboxyl groups, which are hydrophilic in nature [17, 18]. Since the active site of α-amylase tends to favour hydrophobic interactions, these compounds showed lower binding affinities compared to AQ12. However, their ability to form interactions with key residues, specifically, the catalytic residue Asp 197 and the substrate stabilizer His 101, may help compensate for their hydrophilic character. Moreover, they do not rely solely on polar interactions: AQ8 engages in van der Waals contacts with Trp 58 and Leu 165, while AQ13 interacts with both Trp 58 and Trp 59. These hydrophobic interactions contribute to the overall binding stability, allowing AQ8 and AQ13 to remain competitive as potential inhibitors.
Asp 518 and Asp 616 were the catalytic residues crucial for the function of α-glucosidase. Among the 14 compounds, a key residue, Asp 518, was commonly involved in binding both acarbose and AQ9 with the same type of interaction, highlighting AQ9's potential as a promising α-glucosidase inhibitor. The additional bond formed between AQ9 and Arg 600 could contribute to the stability of the compound, as Arg 600 was recorded to be an inhibitor stabiliser by forming hydrogen bonds with the inhibitor [39]. Other compounds interacted with similar residues but through different types of bonds compared to acarbose, suggesting a stronger preference of these residues for the alternative interaction. This may indicate that the compounds possess inhibitory properties through an alternative mechanism of action [40].
For α-glucosidase, the three anthraquinone compounds with the highest binding affinity were ranked as AQ8, AQ13, and AQ1. This enzyme breaks down smaller, more polar oligosaccharides, so it requires hydrophilic residues at its active site for the substrate to bind. A previous study reported that Asp 518 is the catalytic nucleophile in α-glucosidase [39]. Asp 518 is a negatively charged polar amino acid, which means it favours hydrogen bonds over hydrophobic bonds, further supporting the idea that α-glucosidase forms stronger bonds with hydrophilic compounds. AQ8 and AQ13, as mentioned above, had hydrophilic groups, making them potent inhibitors of α-glucosidase.
CONCLUSION
In conclusion, AQ7, AQ9, and AQ12 emerged as the most promising candidates based on their favourable drug-likeness indicators, binding affinity, pharmacokinetic parameters, and safety profiles. AQ13, while requiring attention for potential toxicity, showed excellent solubility, binding strength, and multi-target potential, warranting further investigation. The hydrophobic tert-butyl group in AQ12 enhanced binding with the hydrophobic active site of α-amylase, while polar groups like hydroxyl and carboxyl in AQ7, AQ9, and AQ13 improved interactions with polar residues in α-glucosidase. AQ12 exhibited interactions with Asp 197, a significant catalytic residue of α-amylase, which supported the anthraquinone’s function as an α-amylase inhibitor. AQ9 showed strong binding to α-glucosidase by engaging key residues such as Asp 518 and Arg 600, indicating its potential to mimic or improve upon the mechanism of acarbose. These findings provide a solid foundation for prioritising anthraquinone derivatives for lead optimization and preclinical evaluation in drug discovery efforts.
AUTHORS’ CONTRIBUTIONS
The authors confirm their contribution to the paper as follows: E.X.S.: Writing - Original Draft Preparation; D.R.C.: Writing - Reviewing and Editing; M.M., P.: Data Analysis or Interpretation; C.F.C., Y.S.T.: Writing - Reviewing and Editing; T.A.: Study Concept or Design. All authors have read and agreed to the published version of the manuscript.
LIST OF ABBREVIATIONS
| ADME | = Absorption, distribution, metabolism and excretion |
| AQ | = Anthraquinone |
| BBB | = Blood-brain barrier |
| CNS | = Central nervous system |
| DM | = Diabetes mellitus |
| F-20 | = Bioavailability above 20% |
| F-30 | = Bioavailability above 30% |
| FDAMDD | = FDA maximum recommended daily dose |
| HBA | = Hydrogen bond acceptors |
| HBD | = Hydrogen bond donors |
| LD50 | = Median lethal dose |
| LGA | = Lamarckian Genetic Algorithm |
| Lipinski’s RO5 | = Lipinski’s rule of five |
| Log D | = Distribution coefficient (pH-dependent lipophilicity) |
| Log P | = Lipophilicity (partition coefficient between octanol and water) |
| Log S | = Solubility (logarithm of aqueous solubility) |
| MW | = Molecular weight |
| P-gp | = P-glycoprotein |
| PPB | = Plasma protein binding |
| SMILES | = Simplified Molecular Input Line Entry System |
| t1/2 | = Elimination half-life |
| tPSA | = Topological polar surface area |
| VD | = Volume of distribution |
| VDW | = van der Waals |
AVAILABILITY OF DATA AND MATERIALS
The data and supportive information are available within the article.
FUNDING
The authors would like to thank Manipal University College Malaysia for providing financial support through the MUCM-MRB joint seed grant (MUCM-MRB/002/2024). This research is also partially supported by Universiti Malaya, Malaysia Research Excellence Grant 2024 (UMREG0239-2024).
ACKNOWLEDGEMENTS
Declared none.